
Fancy Stats: Reilly Smith and the Regressing Shooting Percentage
Reilly Smith has been a pleasant surprise for the Bruins this year, after being part of the trade with the Dallas Stars that saw Tyler Seguin leave. His 19 goals puts him one score away from becoming the fifth 20+ goal scorer on the Bruins roster this season – where he’d join Jarome Iginla, Brad Marchand, Milan Lucic, and Patrice Bergeron. That is pretty good company to keep.
While he’s been one of the Bruins best scorers, he had gone through a fifteen game scoreless streak stretching from January 30th, 2014 through March 15th before he scored against the Minnesota Wild on March 17th. That is his longest scoring drought of the season, with his second longest being an eight game stretch near the end of October.
One of the statistics that has made Smith stand out is his Shooting Percentage (SH%). Until the scoreless streak starting on January 30th, Reilly had 18 goals on 96 shots for a SH% of 18.75%. That is significantly more than the league average of 8.12% (calculated from all NHL players who have played more than 20 games). But after the 15 game streak of no goals Smith’s SH% fell to 14.52% – a drop of 4.23%.
What we see is likely a natural regression to a shooting percentage more in line with how Smith normally performs. During the 2012-13 season Smith had an SH% of 8.8% in 37 games played in the NHL and 13.9% in his 45 AHL games (12.59% when combined). It seems fair to say that Smith’s 14.8% shooting percentage may undergo even further regression to his norm.
The problem arises when natural regression gets labeled a ‘slump’ or a ‘rough stretch’ – which is exactly what Claude Julien did when he revealed he had considered moving Smith off his line with Bergeron and Marchand to get him out of it.
Julien considered switching Reilly Smith and Loui Eriksson. Didn’t, partly because Smith had to fight through tough stretch.
— Fluto Shinzawa (@GlobeFluto) March 18, 2014
One of my favorite Twitter follows referenced Fluto’s Tweet as an example of the Bruins’ ignorance towards normal SH% regression, and suggested correctly that the SH% was bound to fall and people would likely overreact.
LRT – This organization will never understand shooting percentage regression, I guess. — Gus Booth (@CommissarTaco) March 19, 2014
*stands up on soap box* I told you all that the day would come when Smith’s SH% fell and people would be mad at him! That day has come! — Gus Booth (@CommissarTaco) March 19, 2014
But it had me thinking – what if there is a coaching point underneath all of this. Yes a SH% will likely regress and normalize over time, and a coach making roster and line decisions while ignoring this fact is bad. But what if we can look for a cause of the regression and instead of having Smith ‘fight through tough stretch’ a coach could give him viable mechanics to tweak in order to correct the regression.
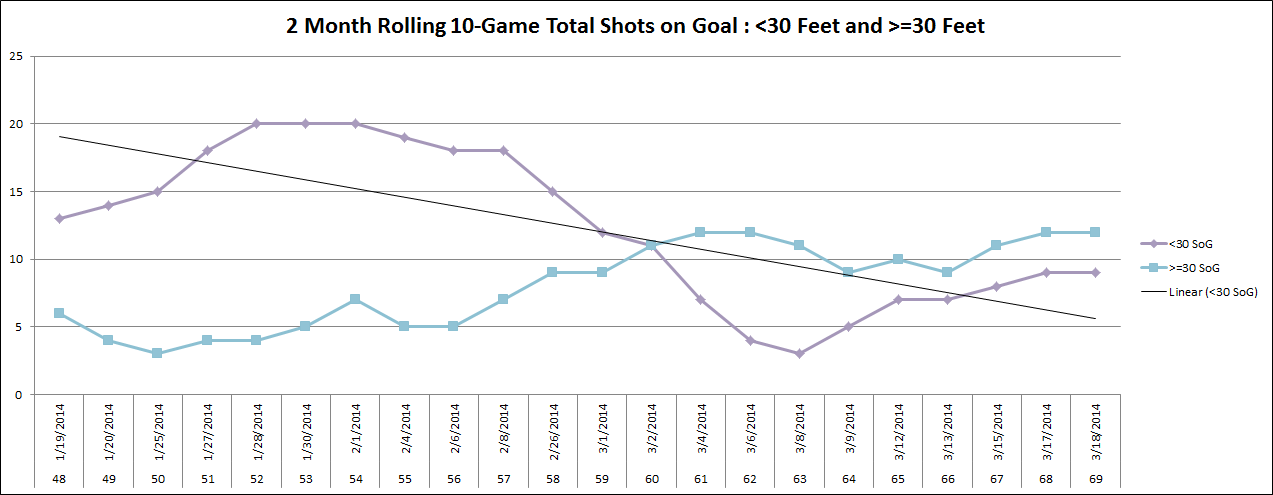
My guess was that the cause of Reilly’s SH% regression was more than just it normalizing, but that something had changed in the shots he was taking. I looked into where Smith’s successful shots come from and it turns out 79% of his goals come from within 30 feet of the goal. I compiled all of Reilly’s shots for the season and plotted them out below, then I focused on the two months (1/19 – 3/19) that included and book-ended his scoreless streak. Using a rolling 10-game total of shots I split them into those that were less than 30 feet from the goal and the rest. When you look at the drastic drop in Reilly’s SH%, it lines up perfectly with a switch to predominantly shots from outside that 30 foot range.
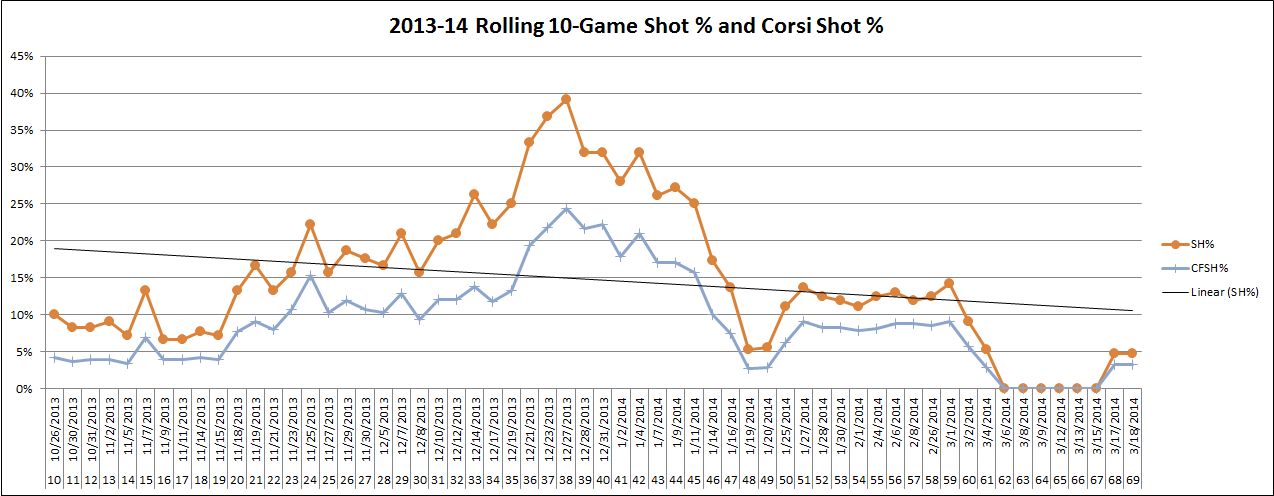
First let’s look at his full season rolling SH%. We can see the dramatic increase that led to his 18.75% high, but if you look at the trend line, it’s a pretty steady regression from that 18.75% down to around 15% – his current SH%.
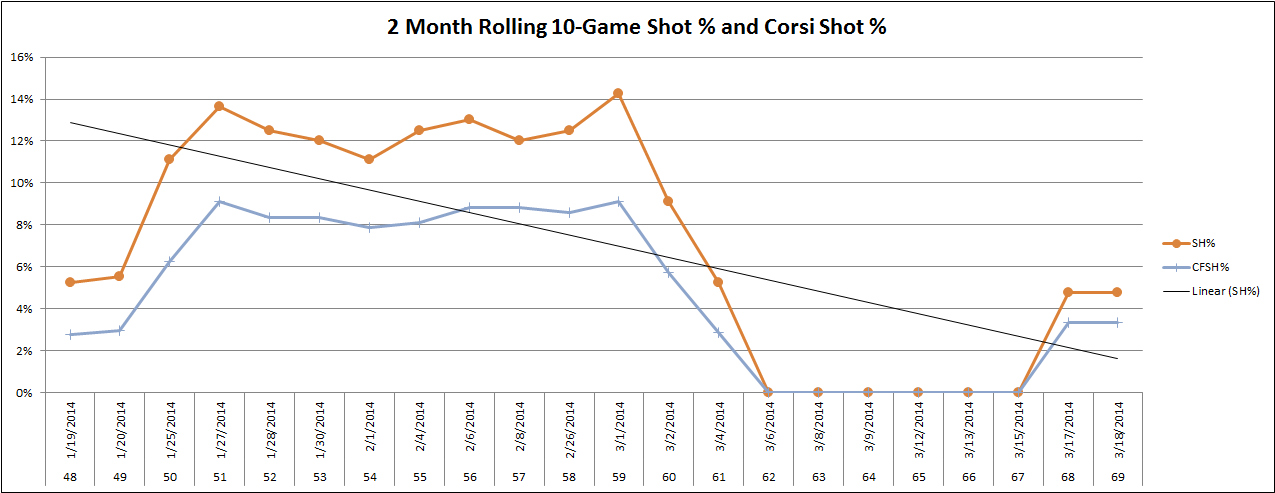
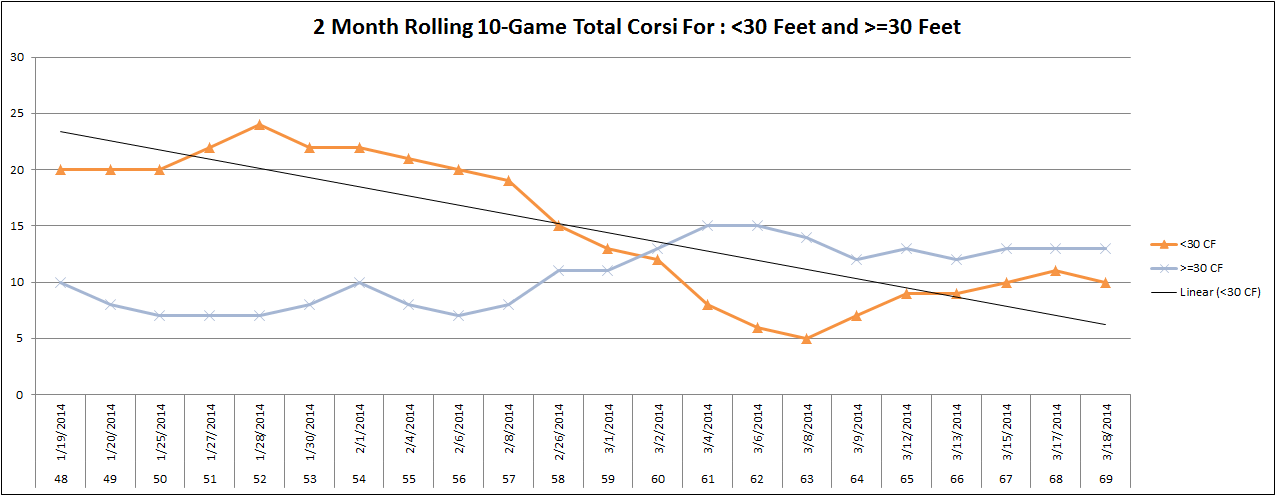
But what we really want to investigate is that drop down to 0% – the ‘tough stretch’ Julien mentioned. The following charts focus in on that time period – pay attention to 3/2/2014. This is the start of the dive in SH% and you will also see, it’s when the effect of Smith putting more Shots on Goal from outside the 30 foot range took hold. I also included a Corsi For chart – unfortunately blocked shots do not get assigned distance information so they are excluded (I guess it’s more a Fenwick For chart) – but the same pattern holds true. Smith was shooting from outside the 30 foot range.
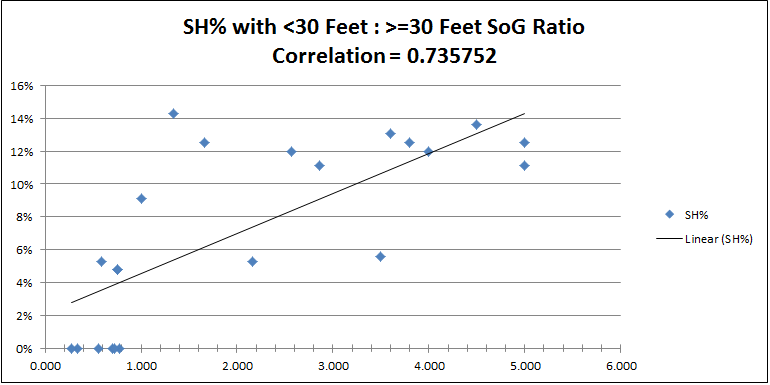
To wrap up this analysis I wanted to see how the closely Smith’s shooting percentage was correlated to the location of shots during that time. I create a ratio of less than 30 feet shot to the rest. For example 4 shots on goal from less than 30 feet and 2 from outside 30 feet is a ratio of 2.000. If it was 1 shot from less than 30 feet to 4 from outside 30 feet the ratio would be 0.250. When this rolling 10-game total is plotted with his rolling 10-game SH% we can see a pretty decent correlation. When the ratio increases from 1.000 the shooting percentage tends to increase.
Is the change in shot location the only factor in Smith’s shooting percentage, of course not, but I think it’s significant enough to be at least part of the cause for the regression. What I take from this is that there was a missed coaching opportunity. Obviously I’m not there at the practice rink so I don’t know what was communicated to Smith – but a better message than ‘fight through this though stretch’ would be for him to focus on being patient with the puck and waiting that extra beat to get into his shooting lanes. I’d argue that an uninformed coaching decision to re-arrange lines would send the wrong message to him and could have had the unintended affect of disrupting other players – maybe the Swedish Connection of Loui Eriksson and Carl Söderberg wouldn’t have developed into what it is now.
Now that Smith has scored it will be interesting to see how big his bounce back is. I’ll put together a follow up post at the end of the regular season to see if his shot location switched back to predominantly within 30 feet and how that impacted the SH%.
To selfishly tie this all in with my Fancy Stats series – I feel this is an example of how statistics can support and draw attention to a hockey question. Why was Reilly Smith’s SH% regressing? Overall it seems to be a natural regression towards his normal shooting percentage. But if we start asking the correct questions, we can leverage additional data to identify potential areas to correct the regression – and ultimately do a better job coaching a player without making drastic changes affecting the whole team in the hopes to snap them out of a ‘slump’.
[SOURCES]
Corsi Event data compiled from ExtraSkater.com Game Logs
League Shooting Average Compiled from Hockey-Reference.com Skater Statistics
Hello
YOU NEED QUALITY VISITORS FOR YOUR: dekesanddangles.com ?
WE PROVIDE HIGH-QUALITY VISITORS WITH:
– 100% safe for your site
– real visitors with unique IPs. No bots, proxies, or datacenters
– visitors from Search Engine (by keyword)
– visitors from Social Media Sites (referrals)
– visitors from any country you want (USA/UK/CA/EU…)
– very low bounce rate
– very long visit duration
– multiple pages visited
– tractable in google analytics
– custom URL tracking provided
– boost ranking in SERP, SEO, profit from CPM
CLAIM YOUR 24 HOURS FREE TEST HERE=> ventfara@mail.com
Thanks, Albertina Santiago